
Most people over 50 who care about their health have had a doctor tell them their numbers are “fine” while still feeling tired, soft around the middle, and slower to recover from a hard week. Fine on a lab report is not the same as built to last. If you want a clearer picture of how you’re actually aging, you need a small set of numbers you can track yourself, understand, and move.
This is a practical guide to those numbers: what they are, why they matter more after 50 than they did at 30, and a 90-day plan to measure and improve them.
What “metabolic longevity” actually means beyond the buzzword
Metabolic longevity is not a single test or a supplement stack. It is the combined state of how well your body manages blood sugar, blood pressure, inflammation, and the fuel it burns at rest and under load. When those systems work well together, your energy stays steady, your weight is easier to manage, and your risk of heart disease, type 2 diabetes, and cognitive decline drops.
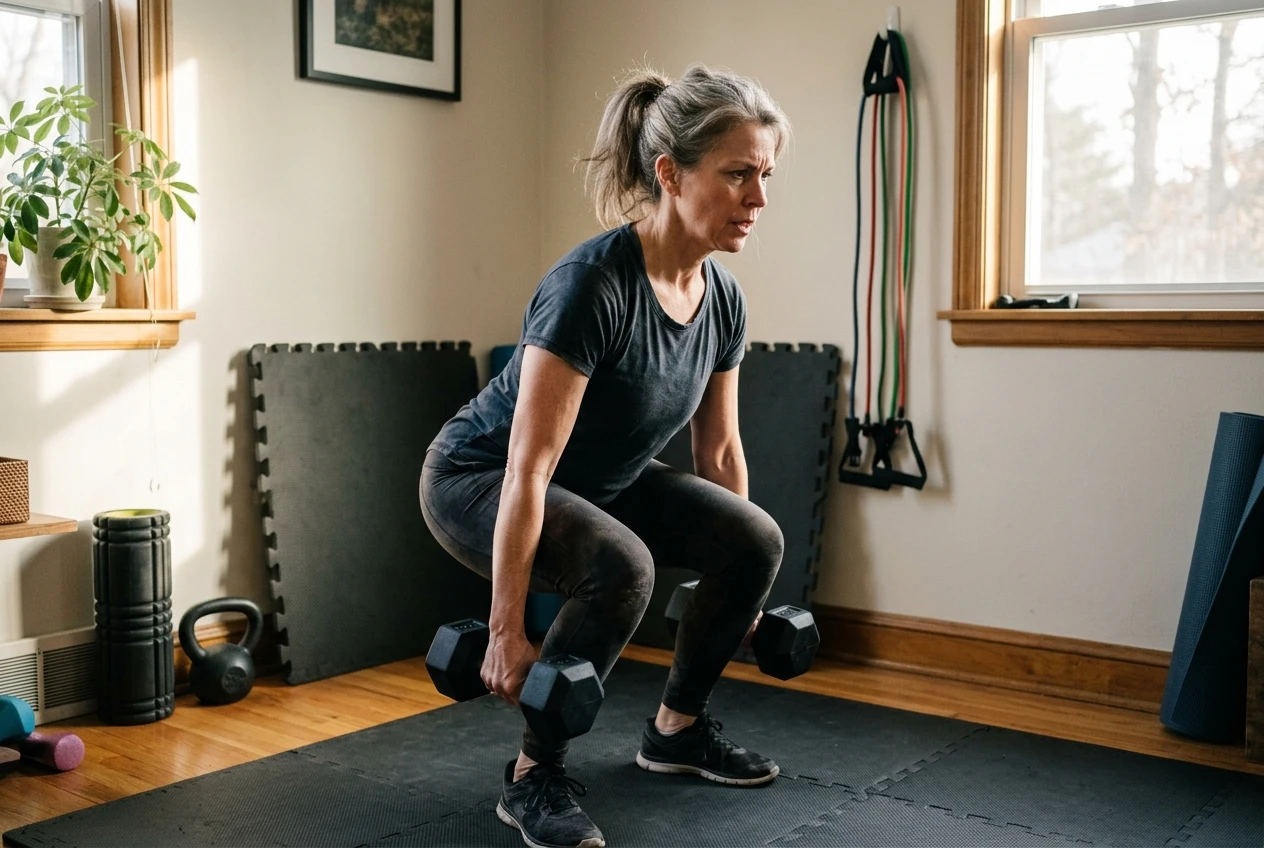
The reason this matters more after 50 is simple: muscle mass declines by roughly 1 to 2 percent a year from your 40s onward unless you actively work against it, and that loss directly worsens blood sugar control, resting metabolic rate, and cardiovascular fitness. Metabolic health in your 50s, 60s, and beyond is not something that happens to you. It responds directly to what you do with your muscles, your meals, and your movement.
The Hub has already covered why this matters for lifespan in detail, including the link between metabolic health and muscle mass. This article is about turning that understanding into a dashboard you can actually check.
The five numbers worth knowing

You do not need a lab coat or a subscription to a health app to track metabolic health. Five numbers, most of which you can measure at home, tell you almost everything you need to know.
Waist-to-height ratio
Divide your waist measurement (taken at the navel, standing relaxed) by your height, using the same units for both. A ratio under 0.5 is the general target for most adults. This number matters more than body weight or BMI because it specifically reflects visceral fat, the fat packed around your organs that drives insulin resistance and inflammation. Two people can weigh the same and carry very different metabolic risk depending on where that weight sits.
Fasting glucose
This is your blood sugar level after at least 8 hours without food, usually measured first thing in the morning. A fasting glucose under 100 mg/dL (5.6 mmol/L) is considered normal, with 100 to 125 mg/dL (5.6 to 6.9 mmol/L) flagging prediabetes. You can get this tested at a routine blood draw, or track it at home with an inexpensive glucose meter if you want more frequent readings. Even a few points’ improvement over 90 days is worth tracking, because fasting glucose tends to drift upward with age unless muscle and activity push back against it.
Blood pressure
High blood pressure is often called the silent problem because it produces no symptoms until it causes a real one. A home reading of around 120/80 mmHg or lower is the general target, though your doctor may set a different goal depending on your history. What matters for this dashboard is consistency: the same device, same arm, same time of day, so the trend is meaningful rather than noisy.
Resting heart rate
Your resting heart rate, taken first thing in the morning before you get out of bed, is one of the simplest and most useful fitness markers available. A lower resting heart rate generally means a stronger, more efficient heart, since it has to pump less often to move the same amount of blood. Most healthy adults sit somewhere between 60 and 80 beats per minute at rest, and well-conditioned individuals often sit lower. This number moves with training faster than almost anything else on this list, which makes it satisfying to track.
Grip strength
Grip strength might seem like an odd inclusion on a metabolic dashboard, but it is one of the strongest predictors of overall longevity in the research, closely tied to total body muscle mass and functional strength. A cheap hand dynamometer gives you a number in kilograms you can track over time. It is also one of the easiest numbers to improve, because grip strength responds quickly to any resistance training that involves holding, carrying, or pulling.
Together, these five numbers give you a genuine picture of metabolic health after 50 that goes well beyond what the bathroom scale tells you.
Why muscle mass and VO2 max move these numbers more than diet alone
Diet gets most of the attention in conversations about metabolic health, and it matters. But after 50, muscle mass and cardiovascular fitness do more heavy lifting than most people realize, often more than diet changes alone.
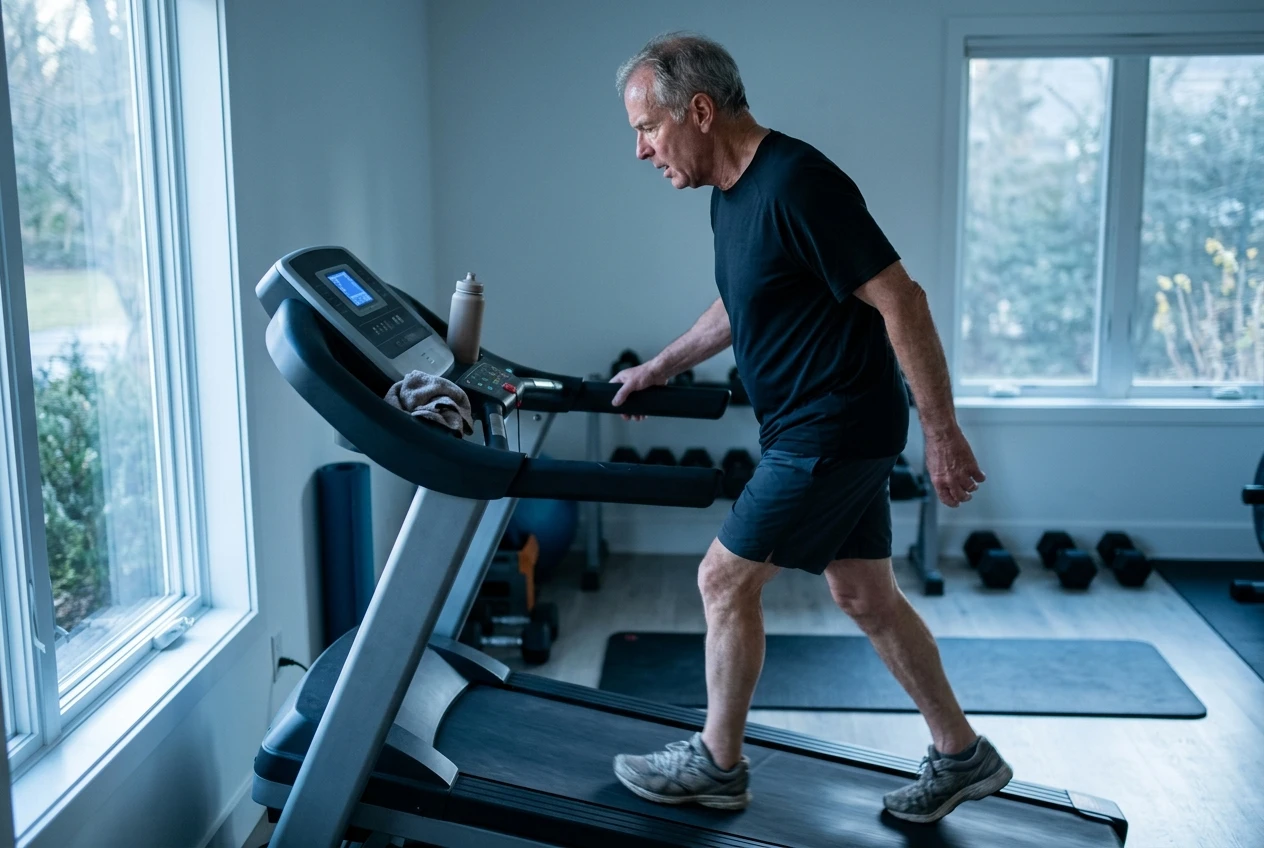
Muscle tissue is metabolically active even at rest. It is also the primary site where your body stores and uses glucose. More muscle means more capacity to clear sugar from the bloodstream after a meal, which directly improves fasting glucose over time. It also raises your resting metabolic rate, meaning you burn more calories simply existing, which makes weight management easier without requiring extreme dietary restriction.
VO2 max, a measure of how efficiently your body uses oxygen during exercise, is one of the single best predictors of long-term mortality risk in the research, outperforming many traditional risk factors. Improving it lowers resting heart rate, improves blood pressure regulation, and strengthens the heart’s ability to handle stress, physical or otherwise. If you want a structured approach to building this, the Hub’s guide to improving VO2 max walks through how to train it specifically rather than hoping it improves as a side effect of general exercise.
Waist-to-height ratio also responds strongly to strength training, not just calorie counting, because building muscle while losing fat changes body composition in a way the scale alone cannot show. If you’re working on building muscle specifically after 50, the Hub’s guide on how to build muscle after 50 lays out a simple three-day approach that fits around joint concerns and recovery needs.
This does not mean diet is irrelevant. It means diet and training work on different levers, and after 50, the training lever tends to be underused relative to how much it can move these five numbers.
Where fasting and gut health fit into the picture
Fasting and gut health are not separate wellness trends sitting next to metabolic health. They are mechanisms that directly affect several of the five numbers above.
Intermittent fasting, done sensibly, gives your body extended periods without a constant stream of glucose to manage, which can improve insulin sensitivity and support better fasting glucose readings over time. It is not a requirement for metabolic health, but for many people over 50 it is a practical tool that also makes calorie management easier without obsessive tracking. If you’re curious about starting, the Hub’s practical guide to fasting after 50 covers how to ease into it without the common mistakes that make people quit in the first week.
Gut health connects to this dashboard through inflammation and metabolic regulation. A gut microbiome that is out of balance is linked to higher systemic inflammation, which in turn is linked to insulin resistance and higher blood pressure. This is not about buying every probiotic on the shelf. It is about supporting the gut with food and habits that have evidence behind them. The Hub’s article on the benefits of good gut health explains the mechanism in more depth, and if you want something concrete to add to your routine, the L. reuteri yogurt recipe is a simple starting point many readers have found easy to stick with.
Neither fasting nor gut health will move these five numbers on their own the way muscle and cardiovascular training do. But they remove friction from the process and support the same underlying systems.
A simple 90-day plan to track and improve your metabolic dashboard
You do not need to overhaul your life overnight. A 90-day window gives your body enough time to show real change in these numbers while staying short enough to keep you motivated.

Week 1: Baseline. Measure all five numbers before you change anything. Waist-to-height ratio, fasting glucose, blood pressure, resting heart rate, and grip strength. Write them down somewhere you’ll actually look at again, whether that’s a notebook or a simple spreadsheet. This baseline is the only way to know if anything you do actually works.
Weeks 2 to 4: Build the habit, not the intensity. Start two to three resistance training sessions a week focused on compound movements that build overall muscle: squats, rows, presses, carries. Add two short periods of weekly cardiovascular work that pushes your heart rate up, even if it’s just brisk walking on an incline or cycling. Keep food changes modest: more protein, less ultra-processed food, consistent meal timing if you’re experimenting with fasting.
Weeks 5 to 8: Add structure and consistency. By now the habit should feel less effortful. This is the window to increase training load slightly, whether that’s more weight, more reps, or a longer cardio session. Re-measure resting heart rate and waist-to-height ratio at week 6. These two tend to move fastest and give you early feedback that keeps motivation up.
Weeks 9 to 12: Re-test everything and adjust. Take a full re-measurement of all five numbers under the same conditions as your baseline. Compare the results. If grip strength or resting heart rate have improved but waist-to-height ratio has barely moved, that tells you where to put more attention in the next 90-day block, whether that’s tightening nutrition or adding a session.
Throughout the 90 days, the training side of this plan matters as much as the measuring. If you’re building a home setup to make consistent training easier, the Hub’s guide to home gym equipment for over 50s covers joint-friendly options that won’t sit unused in a corner.
Tools worth having at home to measure your own progress
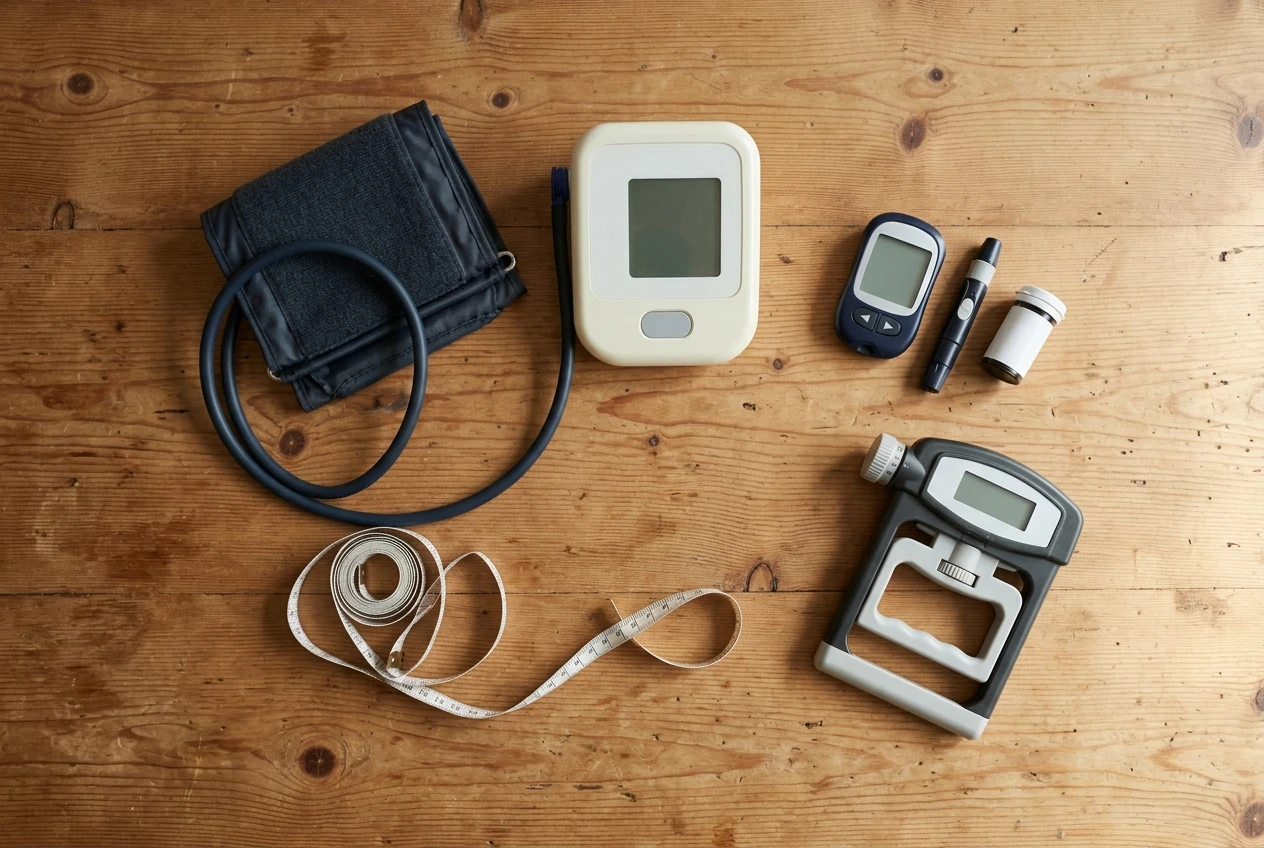
You don’t need expensive equipment to track this dashboard, but a few basic tools make consistent tracking far easier than relying on memory or occasional doctor visits.
- A tape measure for waist-to-height ratio. Costs almost nothing and takes thirty seconds.
- A home blood pressure monitor, the upper-arm cuff style rather than wrist, for accurate and consistent readings.
- A basic glucose meter, if you want more frequent fasting glucose readings than an annual blood test provides.
- A hand dynamometer for grip strength, a small one-time purchase that gives you a genuinely useful longevity marker.
- A fitness tracker or simple heart rate monitor for resting heart rate, though a finger on your wrist and a stopwatch works just as well if you’d rather not buy anything.
None of these require technical skill or a big budget. What they require is consistency: measuring the same way, at the same time of day, and actually writing the numbers down so the trend means something.
Pick up a basic home blood pressure monitor and a tape measure this week so you can take your first baseline reading before you start the 90-day plan.